Pie charts are a great way to show the distribution of data. They are particularly appropriate for showing such things as percentages, market shares, or the breakdown of a budget. The following article will show you how to create a pie chart in Google Slides.
How To Make A Pie Chart In Google Slides

To create a pie chart in Google Slides, go to the menu bar, click “Insert,” and then select “Chart” from the drop-down menu, followed by “Pie” from the secondary drop-down menu.
Now, select “Edit in Sheets” to begin entering data. Return to Google Slides and click the “Update” button in the top right corner of the chart after you’ve added the data.
To insert the pie shape into your Google slide, Select Insert > Shape > Shapes > Select the Pie shape.
Here’s how to make a pie chart in Google Slides:
- Click “Insert” from the menu bar
- Select “Chart” from the drop-down menu
- Select “Pie” from the secondary drop-down menu
- Click on “Edit in Sheets”
- Edit the pie chart
- Click the “Update” button
1. Click “Insert” from the menu bar
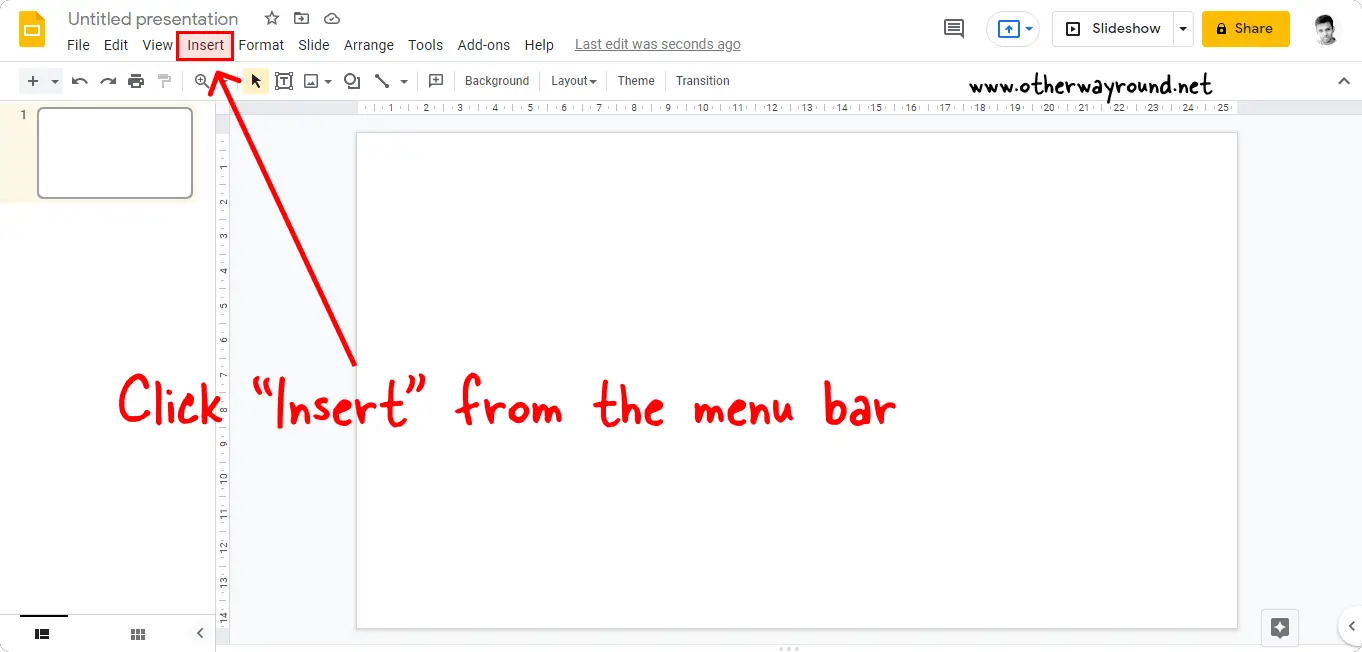
The first step is to open Google Slides and add a new slide if you haven’t already.
You’ll now see a menu bar at the top of the screen, just below the presentation name, with options like File, Edit, View, Insert, Format, Slide, Arrange, Tools, Add-ons, and Help.
You must select “Insert” from the menu.
2. Select “Chart” from the drop-down menu
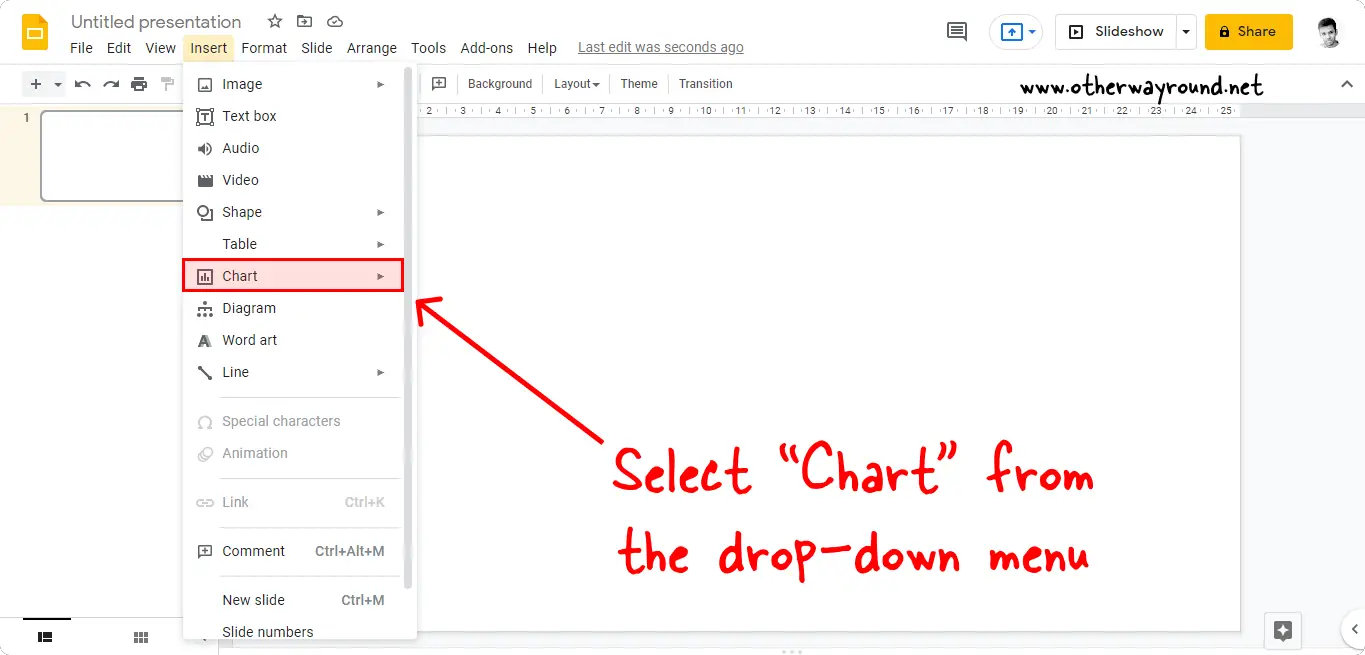
After clicking “Insert”, you’ll get a drop-down menu with several options. This list contains all of the items that you can insert into your slide.
Also read: How To Make A Picture Circular In Google Slides
Images, tables, charts, lines, and Word art can all be inserted. You can also insert audio and video to enhance your presentation.
Select “Chart” from the list of options in the drop-down menu and move on to the next step.
3. Select “Pie” from the secondary drop-down menu
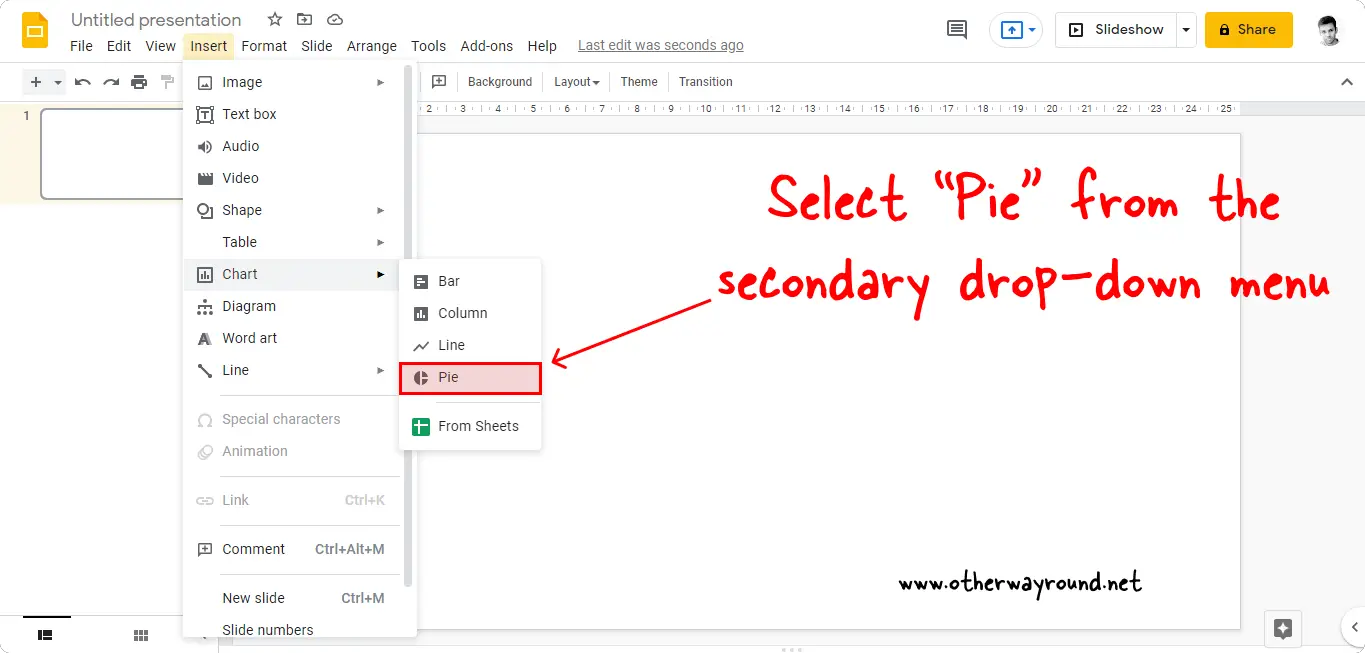
Following the selection of “Chart” from the drop-down menu, a secondary drop-down menu appears.
In your Google Slide, you can include a Bar, Column, Line, or Pie chart.
Simply select “Pie” from the list of options to insert a pie chart.
4. Click on “Edit in Sheets”
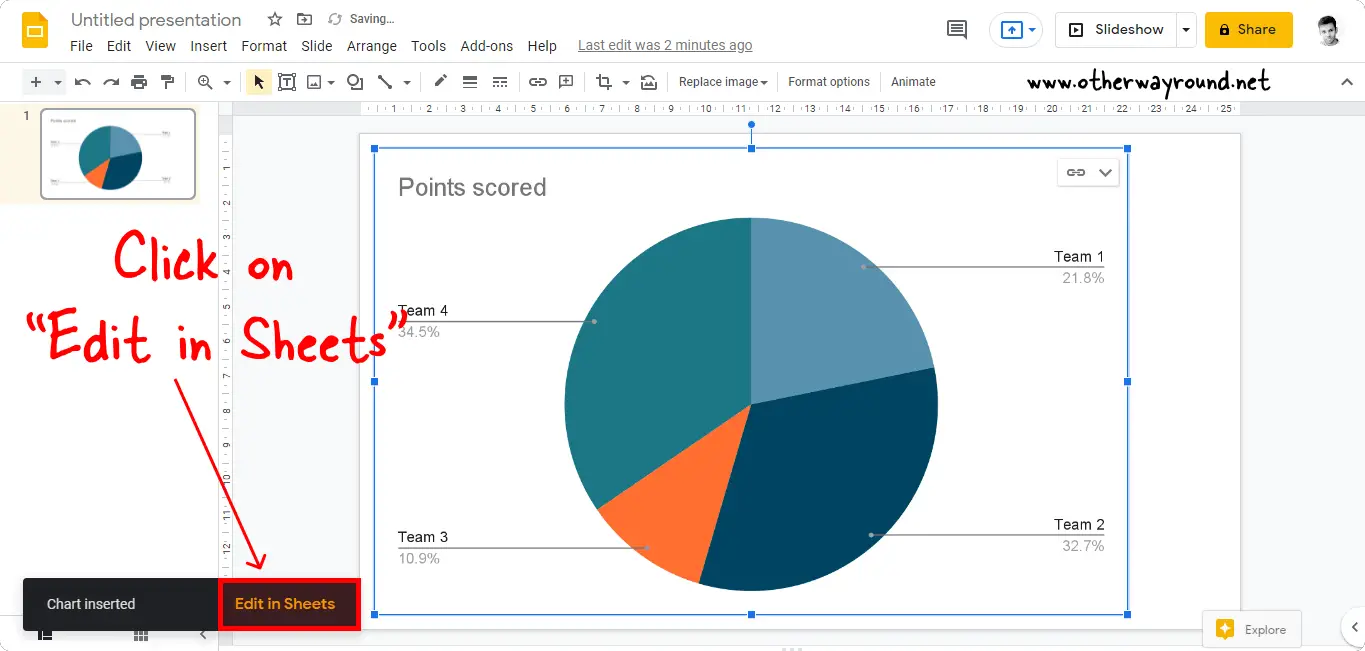
When you choose “Pie” from the drop-down menu, you’ll notice a tab in the bottom left corner that says “Inserting the chart…”. Allow up to 5 seconds for Google Slides to insert the chart into the slide.
When the chart is inserted, the tab will indicate that it has been inserted and will provide the ability to change the slide in Google Sheets.
To edit the chart, click the yellow text that says “Edit in Sheets” on the tab. The pie chart cannot be edited within Google Slides.
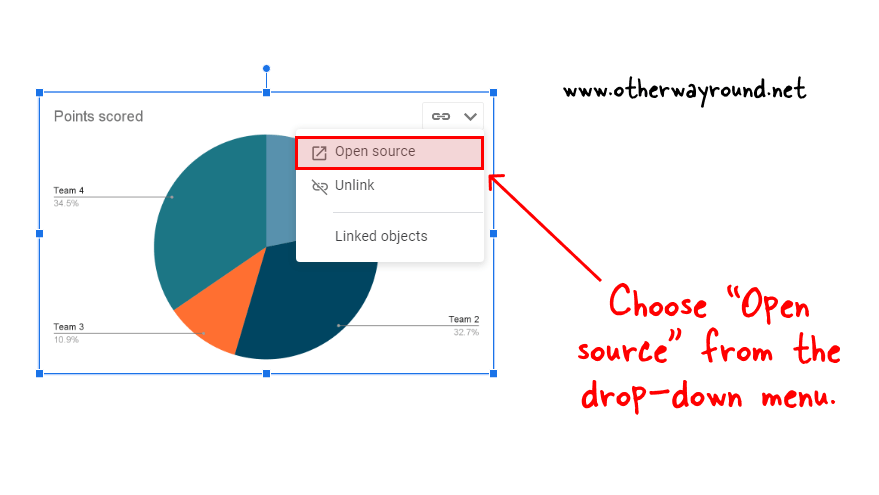
After inserting the chart, the tab in the bottom left corner vanishes in five seconds. So, if you missed the tab, you’ll need to click on the down arrow in the top right corner of the pie chart. Choose “Open source” from the drop-down menu.
5. Edit the pie chart
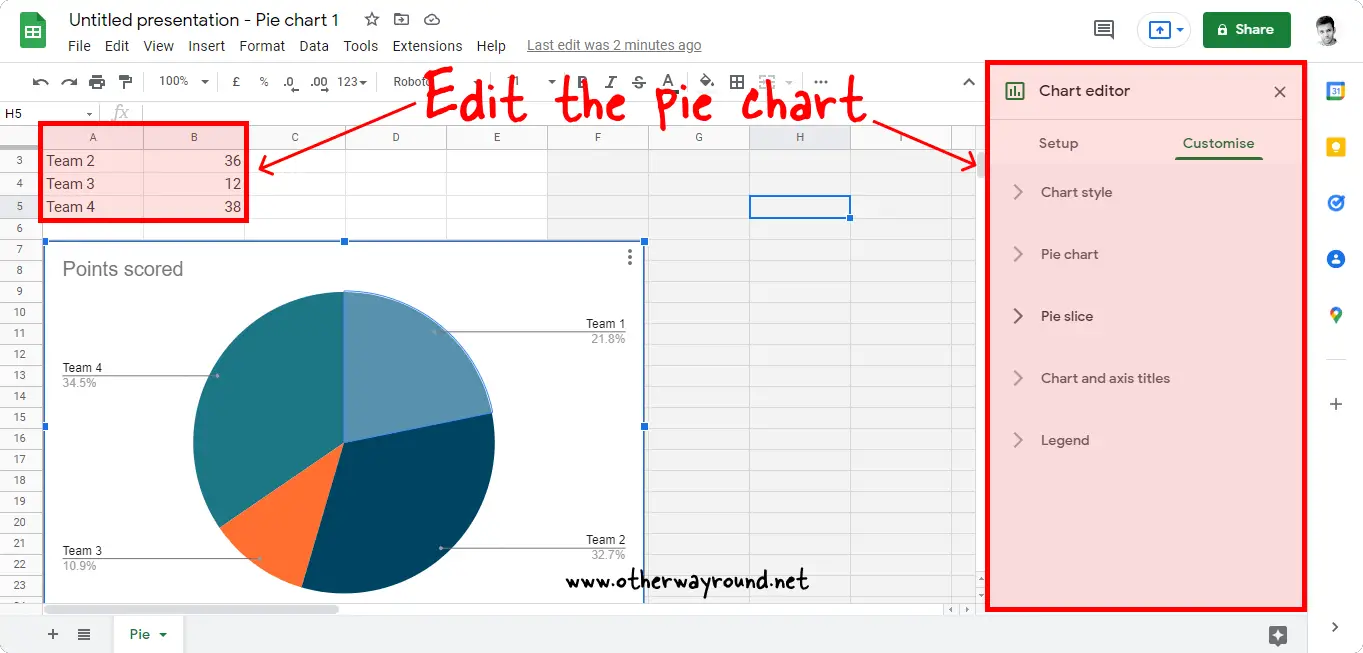
You will now be taken to the Google Sheets tab, where you will see the same pie chart that was on your Google slide.
Here, you’ll see a table with sample data below it you’ll see the pie chart. Edit the pie chart according to your needs.
To open the “Chart editor” sidebar, double-click on the pie chart. There are two tabs in this sidebar: Setup and Customise. Select the “Customise” tab. From here, you can alter the background and chart border color. To make the pie chart 3D, click the “3D” checkbox.
Select “Pie slice” to modify the color of the slices. Change the color of each slice by selecting it. You can also relocate the legend. To do so, go to the “Legend” toggle menu and then to the “Position” drop-down menu to see all available positions.
6. Click the “Update” button
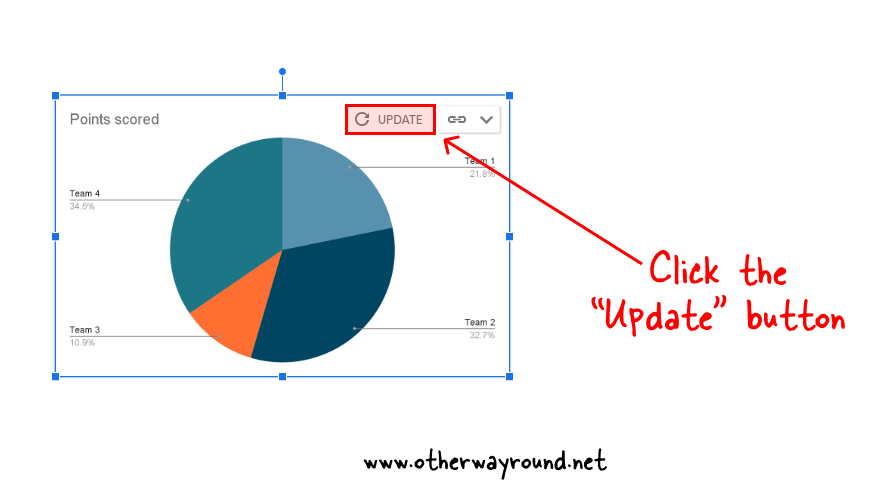
Return to the Google Slides tab of your browser after you’ve finished altering the pie chart in Google Sheets. The chart will not be updated here. You must manually update the chart.
To do so, click the “Update” button in the pie chart’s upper right corner. The chart may take up to 5 seconds to update.
Finally, resize the pie chart to fit your requirements.
Conclusion
We hope you enjoyed our blog post on how to make a pie chart in Google Slides. We know that sometimes it can be difficult to create a pie chart in Google Slides, so we wanted to share with you how you can make one!
Following these easy steps should help you with creating a pie chart in Google Slides.
