This is a complete list of up-to-date Phishing stats.
On this page we’ve compiled statistics on:
- Email Phishing Statistics
- Mobile Phishing Statistics
- Phishing Victims Statistics
- Social Media Phishing Statistics
- Covid-19 Phishing Statistics
- Phishing Statistics By Country
- Top URL Shorteners Used For Phishing
Let’s get right into the stats!
Phishing Statistics

Email Phishing Statistics
1. Email is the primary medium for 96% of phishing attacks.[1]

2. 1 out of every 4,200 emails in 2020 was a phishing email.[2]
3. 46% of companies got malware through email.[3]
4. 78% of all phishing emails are sent during the work week, while just 22% are saved for the weekend.[4]
5. Employees of smaller companies were more susceptible to email risks, such as spam, phishing, and email malware than employees of large corporations.[5]
6. Microsoft Office files made up nearly 50% of all malicious email attachments in 2018.[5]

7. Between 2018 and 2020, there was a significant increase in the quantity of malicious Microsoft Office and PDF files distributed via email.[6]
8. In 2017, the percentage of emails containing malicious URLs increased to 12.3%; however, by 2018, it had decreased to 7.8%.[5]
9. The following sectors were targeted by a significant number of malicious emails:[7]
- Retail (an annual average of 49 phishing emails per worker)
- Manufacturing (31)
- Food and beverage (22)
- Research and development (16)
- Tech (14)
10. The information comes from Avanan’s Global Phish Report, which examined 55.5 million emails sent to Microsoft Office 365 and Google G Suite accounts. Of the 55.5 million emails examined, 561,947 were phishing attacks.[8]
11. Nearly 20% of all employees are likely to click on phishing email links, and a startling 67.5% of those proceed to submit their credentials on a phishing website.[9]
12. According to a recent analysis by INKY, Microsoft is the brand that is most commonly impersonated, with emails posing as Microsoft-related expected to make up about 70% of all phishing attempts in 2020. Zoom, Amazon, Chase Bank, and RingCentral are the next most commonly impersonated brands.[10]
13. Malicious email attachments are responsible for 66% of malware installation.[11]

14. Approximately one-third of phishing emails are opened. This raises the likelihood of a person accidentally clicking on a malicious link or downloading a convincing-looking document loaded with malware.[12]
15. During the first quarter of 2022, 23.6 percent of global phishing attacks targeted financial institutions. Furthermore, web-based software services and webmail accounted for 20.5 percent of attacks, making these two businesses the most targeted for phishing.[13]
16. 23% of those who get phishing messages open them, and 11% click on the attachments. Approximately half of such activity happens during the first hour after the reception.[14]
Mobile Phishing Statistics
17. Email is undoubtedly the initial point of attack for a phishing actor, and today, more than 66% of emails are opened on a mobile device first.[15]
18. Since 2011, mobile phishing attacks have increased at a consistent rate of 85% each year.[16]

19. In the first quarter of 2020, mobile phishing attacks rose by 37%.[17]
20. As of May 2022, users in Egypt had a 47 percent encounter rate with mobile phishing attempts aimed at credential theft.[18]
21. Between the second half of 2020 and the first half of 2021, mobile phishing exposure increased 161% in the energy industry.[19]
22. In the first half of 2021, 20% of energy employees were targeted by a mobile phishing attack, a 161% rise over the second half of 2020.[19]
23. North America (11.2%), Asia-Pacific (13.2%), Europe, the Middle East, and Africa (15.8%) have the highest rates of mobile phishing exposure.[19]
24. Employees in Europe, the Middle East and Africa, and Asia-Pacific were 41% and 18% more likely to be victims of a mobile phishing attack than their North American counterparts.[19]
25. Proofpoint processed more than 80% of North America’s mobile messages, and data show that mobile phishing messages rose by 328% in Q3 2020 compared to Q2 2020.[20]
26. 84% of firms are affected by mobile-based phishing attacks.[21]

27. By the middle of 2020, there has been a 328% increase in SMS-based scams.[20]
Phishing Victims Statistics
28. Over $3.5 billion in losses were recorded as a result of phishing and other frauds, according to the FBI.[22]

29. In 2021, the Internet Crime Complaint Center received 323,972 complaints, a 34% increase over the previous year.[23]
30. Victims of Phishing/Vishing/Smishing/Pharming lost a total of $44,213,707 in 2021.[23]
31. According to a report from the first quarter of 2016, the Ponemon Institute, successful phishing attacks (against major firms with more than 10,000 workers) currently generates $3.7 million for each attack. It should be noted that this occurred despite the adoption of security measures, some of which were specifically intended to prevent such fraud.[24]
32. Phishing attacks hit 465 brands in March 2021, up from 364 in April of the previous year.[25]

Social Media Phishing Statistics
33. When it comes to phishing, social media messages are a major issue, and LinkedIn phishing messages dominate as the top social media email subject to be on the lookout for, with 47%.[26]
34. According to 2019 data from Verizon, 52% of breaches include hacking. 28% of them use phishing emails that send malware payloads, while about 33% of them involve social media attacks.[27]
35. Social media-enabled crimes generate at least $3.25 billion in worldwide income for the global cybercrime economy each year.[28]
36. Social media accounts for more than 12% of phishing URL clicks.[29]

37. A research of over 7,000 harmful Bit.ly shortened URLs (drawn from a total of over 300,000 malicious URLs) reveals that the vast majority were accessed directly, i.e. through instant messaging, email clients, and apps.[29]
38. In 2019, 78% of organizations in the United States reported social media phishing attacks.[30]

39. Facebook is first among the top twenty most impersonated brands in phishing attacks, pushing Microsoft to second place.[31]
40. Monday and Thursday tend to have the most phishing messages on Facebook, while the weekend appears to have the least.[31]
41. The number of social media attacks per target grew 103% since January 2021, when firms faced an average of just over one threat per day.[32]
42. As of the first quarter of 2022, the social media industry is the fifth most targeted industry for phishing attacks. The financial industry is at the top of the list.[33]
Covid-19 Phishing Statistics
43. According to the fourth edition of the Phishing and Fraud Report, phishing incidences increased 220% during the peak of the worldwide pandemic compared to the yearly average.[34]

44. The number of phishing instances in 2020 is expected to rise 15% year on year, although this might alter quickly as new waves of the pandemic spread.[35]
45. According to a study of IT security professionals globally, the most significant increase in cyber threats since the COVID-19 outbreak has been in the area of data exfiltration and leakage.[36]
46. According to data obtained in the first quarter of 2020, about two-thirds of respondents from Interpol member nations have received phishing and online fraud threats relating to COVID-19.[37]
Phishing Statistics By Country
47. Brazil was the country with the most users targeted by phishing attacks in 2021, followed by France and Portugal.[38]

48. Phishing does not affect all nations and areas to the same amount or in the same way. Here are some numbers from another source indicating the proportion of businesses that faced a successful phishing attack in 2020, broken down by country.[39]
- United States: 74%
- United Kingdom: 66%
- Australia: 60%
- Japan: 56%
- Spain: 51%
- France: 48%
- Germany: 47%
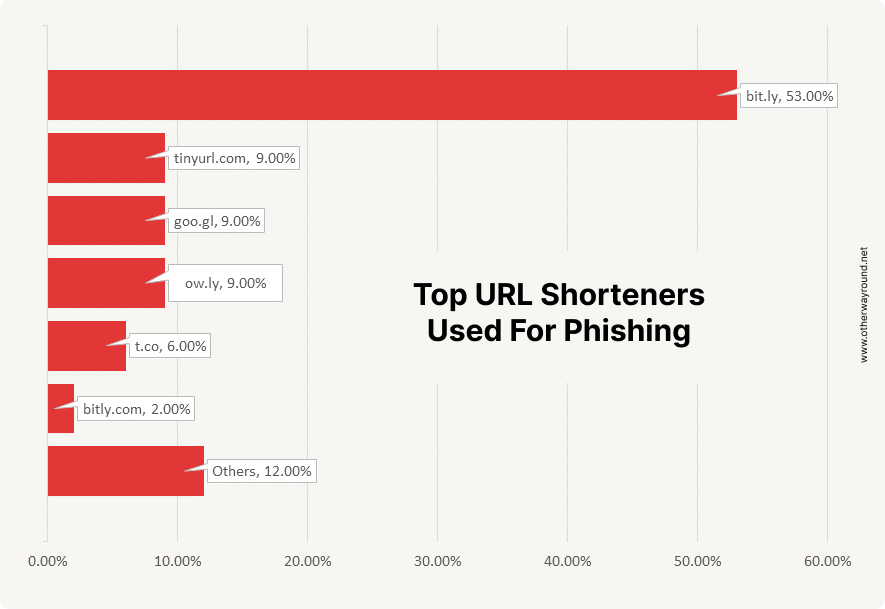
Top URL Shorteners Used For Phishing
49 According to the most recent statistics, the most used URL shorteners for phishing were Bitly (53%), TinyURL (9%), and Goo.gl (9%).[40]
Frequently Asked Questions
What Percentage of Phishing Emails Target The US?
Less than 10% of phishing emails target the US. Brazil tops the list with 12.39%
How Many Phishing Emails Are Sent Every Day?
3.4 billion phishing emails are sent every day.
How Many Phishing Emails Contain Ransomware?
46% of phishing emails contain ransomware that’s 1.5 billion emails.
How Many Phishing Emails Are Sent Per Year?
Over a trillion phishing emails are sent per year.
What Percentage of Emails Are Phishing?
Around 1.5% of emails are phishing.
What Percent of Phishing Emails Are Opened?
More than 30% of phishing emails are opened.
Sources
1. 2022 Data Breach Investigations Report
2. Threat Landscape Trends – Q1 2020
3. Verizon Business 2020 Data Breach Investigations Report
4. Social media phishing attacks are at an all time high
5. Symantec Internet Security Threat Report
6. Sonicwall Cyber Threat Report
7. Tessian Opportunity in Cybersecurity Report 2021
8. 2019 Global Phish Report – Avanan
9. Terranova Security’s 2020 Gone Phishing Tournament
10. The Top 25 Most Phished Brands
11. Verizon Data Breach Investigation Report (DBIR)
12. Verizon Data Breach Investigations Report (DBIR)
13. Online industries most targeted by phishing attacks as of 1st quarter 2022
14. People Are The Problem (And Solution)
15. Majority Of Emails Opened On Apple Devices, Android Users Pay More Attention
16. Mobile Phishing: Myths and Facts Facing Every Modern Enterprise Today
17. 2020 Mobile Phishing Report From Lookout Shows 37% Sequential Increase In The First Quarter Of 2020
18. Mobile phishing encounter rate worldwide as of May 2022, by country
19. Energy Industry Threat Report
20. Security Brief: Mobile Phishing Increases More Than 300% as 2020 Chaos Continues
22. 2019 Internet Crime Report Released
23. FBI Internet Crime Report 2021
24. The Cost of Phishing & Value of Employee Training
26. Q4 2020 KnowBe4 Finds Work From Home-Related Phishing Email Attacks on the Rise
27. Phishing Statistics & How to Avoid Taking the Bait
28. Bromium: Social Media Platforms And The Cybercrime Economy
29. Using URL Shorteners to Compare Phishing and Malware Attacks
30. Proofpoint: State of the Phish 2020
31. Social media phishing attacks are at an all time high
32. Phishing Attacks on Social Media Doubled Over 2021
33. Online industries most targeted by phishing attacks as of 1st quarter 2022
34. 2020 Phishing and Fraud Report
35. Phishing Attacks Soar 220% During COVID-19 Peak as Cybercriminal Opportunism Intensifies
37. Key cyberthreats related to the COVID-19 pandemic in 2020, by threat type
38. Countries most targeted by phishing attacks worldwide in 2021
40. URL shorteners most frequently used for phishing attacks in 2016